3 A bit more about landscape metrics
There are many, many metrics out there to measure landscape pattern. There are two main categories of metrics:
3.1 Composition metrics
These metrics describe the composition of the landscape. They measure things like how many patches there are, what percentage of the landscape is covered by each class (cover type).
3.2 Configuation metrics
The metrics describe how patches and cover types are configured. The measure things like the relationship of patches to each other (interpatch distance) or the probability that certain cover types are adjacent to each other.
To see some of the metrics available in the landscapemetrics package, type the code below:
lsm_abbreviations_names
The table shows the metric abbreviation, the full name, the type of metric it is and the level (patch, class or landscape) to which it applies.
Note, the above code only gives a partial list. If you want to see more (say the first 40 metrics), type the following code:
print(lsm_abbreviations_names, n =40)
3.3 The sample landscape
The landscapemetrics package includes a sample raster map of an area near Augusta, Gerogia, obtained from the US National Land Cover Database (NLCD). To view that map, type the code below:
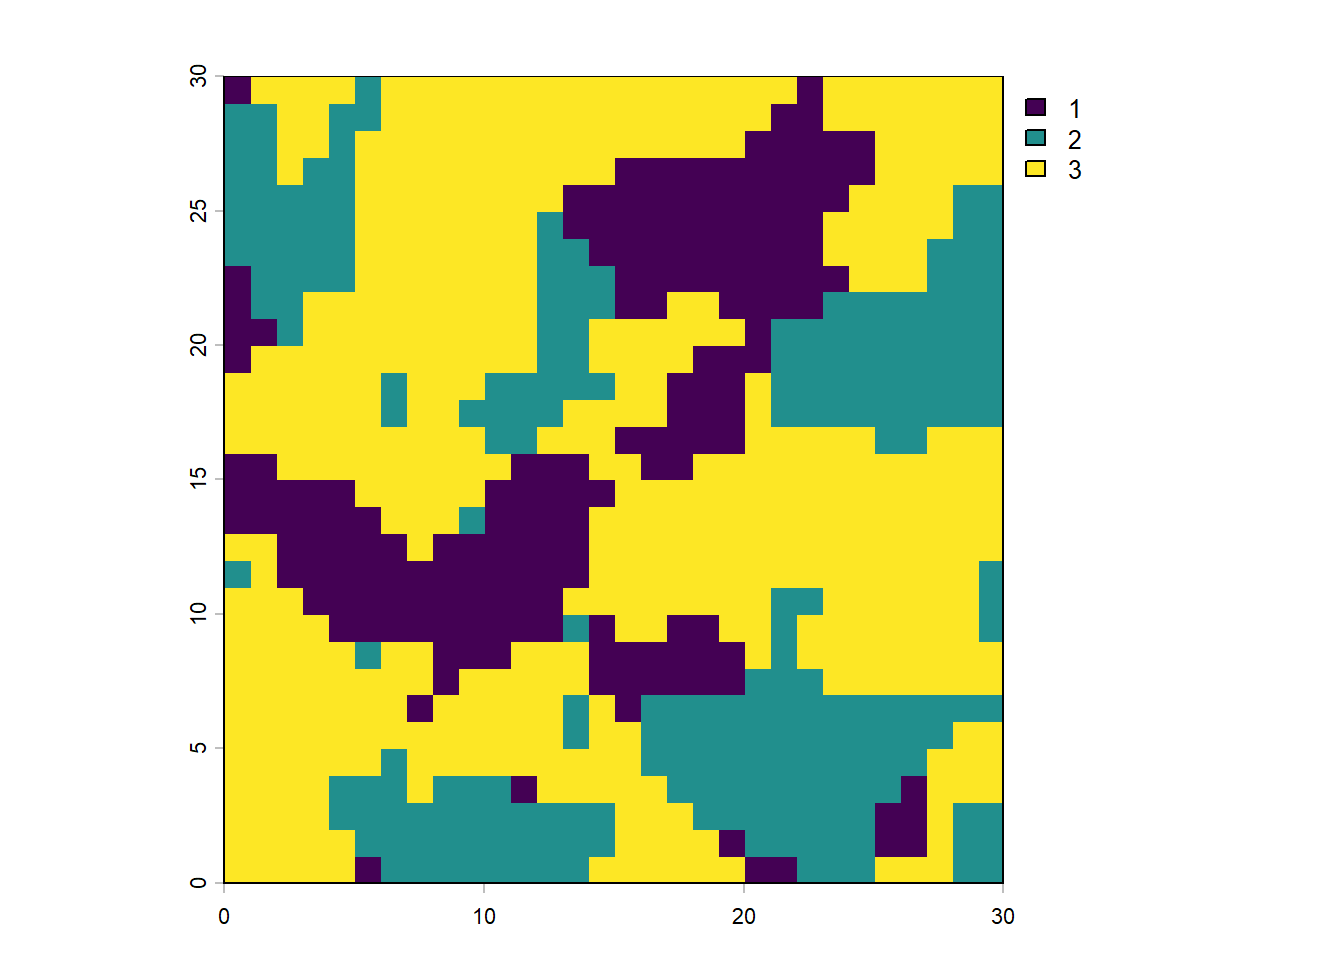
We will be working with this landscape to run through some examples of patch, class and landscape level metrics. To use this on you own landscape, you would simply have to import your own landscape raster file into the working director and then apply the functions to it. Simply, where here the functions use the landscape augusta in the arguments of the function call; you would use the name of your landscape.